Activity report
One of the most important reports that teachers need to check (during the semester, at the end of the semester or before starting a new semester) is the Activity report. It shows how many times course activities (resources, assignments, files, etc.) have been accessed. Moreover, it shows how many users (students and teachers) have accessed this resource (fig. 2). This data evidence helps teachers to reflect on learning design, resources and activities. For example, if you notice that an important activity is not accessed by most of the students, you can decide to give more visibility to this resource by changing its label. You can also add an additional description to the resource and make it visible on the course platform, so that students know why this resource is important for their learning or what specific pages or minutes need to be studied. Finally, prompt messages and reminders in the discussion forum are useful to inform students that some materials need to be analysed for the next class. Of course, each student group is different and learning resources that are valuable to one group might be irrelevant for the other. Therefore, you need to be aware of the overall context and you need to take into consideration other reports as well.
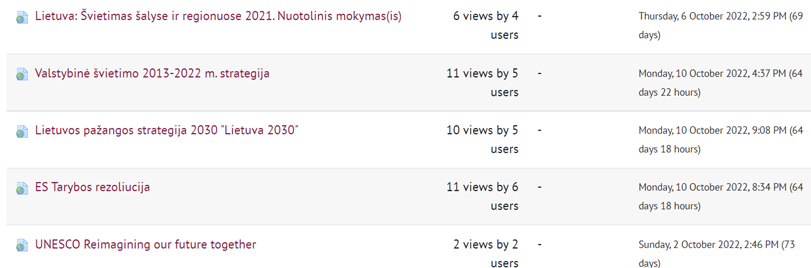
Figure 2. An example of an activity report (Tamoliune, personal communication, 2022, BA study course “Open education policy”, Vytautas Magnus University)
This kind of report helps teachers discuss with students what their learning preferences are, which learning formats they prefer to study the most and how the overall learning process should be organised. If you want to include a learning resource that is not accessed by students a lot, you can use it for in-class discussion.
At the same time, you can see how many users have accessed the discussion forum. Of course, this data on its own does not say a lot about learners’ engagement in discussions, but it provides insights that might be useful to rethink strategies for nurturing the discussion.
Finally, you can create a quiz and ask students to give a quick feedback on which course activities they found most useful. Then, you can compare the data and make informed-decisions accordingly.
These reports represent a valuable tool to identify the students who viewed the resources or activities. Nevertheless, this tool is limited to quantitative data and it does not provide qualitative information on how “meaningful” student's engagement and participation were.
Course completion report
The data generated by this report informs teachers and learners on what needs to be done to have this course completed successfully (fig. 3). It keeps students informed on how they should plan their learning and helps them achieve all the compulsory requirements for the course completion. Moreover, this report is connected with digital badges or other digital credentials based on the course completion. Thanks to this report, it is easier to issue a badge automatically after the requirements are met.
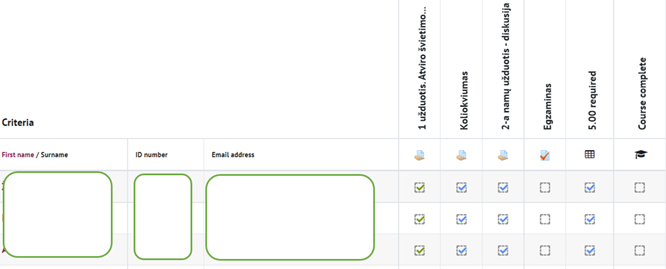
Figure 3. An example of the course completion report (Tamoliune, personal communication, 2022, BA study course “Open education policy”, Vytautas Magnus University)
At the end of the semester, you can analyse how many students have finished their course successfully and what criteria were not achieved by those who failed. As mentioned before, this report does not provide the overall picture but should be analysed taking into consideration other contextual factors.
Important reminder. The Course completion report can only be accessed if “Course completion” has been specifically configured for the course. It should be configured by a teacher at the beginning of the course, when the teacher sets course completion criteria by selecting which activities or resources are compulsory to complete the course successfully.
Quiz
After students have finished the quiz, you can review the data on learners’ engagement with the quiz and its statistics (fig. 4). For example, you can review how long it takes for students to answer each given question, and then reflect if quiz duration amendments are needed. Similarly, you can observe if there were challenging questions or questions that all students failed to answer. Such data provide valuable information to teachers and help them detect if a student did not prepare well for the exam, if the quiz instructions were not clear or if the question is too complicated and needs to be revised.
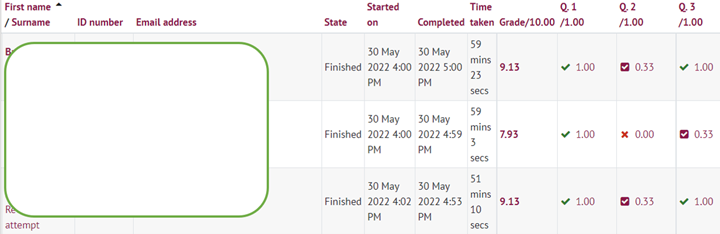
Figure 4. An example of the quiz report (Trepule & Tamoliune, personal communication, 2022, MA study course “Concepts of adult education”, Vytautas Magnus University)
Quiz data analysis can show learners’ behaviour when taking a quiz, so teachers can analyse if a student has accessed any other course or external resource or if any other devices were used. In other words, being aware of learners' behaviour during the quiz time allows teachers to decide how to improve the quiz.
Important! As mentioned in Unit 2.1, it may not always be sufficient to focus on the data from a single report and draw definitive conclusions from it. To draw more objective conclusions about the specific situation or problem under analysis, it is often useful to review and analyse the data generated by different reports and interpret it in a broader context.
References
Van den Bogaard, M., Drachsler, H., Duisterwinkel, H., Knobbout, J., Manderveld, J. & Wit, M. (2016). Report Learning analytics in education design: a guide.
Last modified: Thursday, 22 December 2022, 1:19 PM