Title: Learner Analytics Dashboards (LAD) as feedback and engagement tools for students (Jivet et al., 2021).
University: Erasmus University of Rotterdam
Section of the framework: G - LA generate data on student behaviour
(e.g. Activities for students are created to reflect on their progress of learning and strategies used for learning)
What competencies and learning outcomes of the DigiCompEdu Framework are we addressing?
COMPETENCIES | |
Actively engaging learners
|
PERFORMANCE - monitoring - To use digital technologies to allow learners to collect evidence and record progress, e.g. audio or video recordings, photos. - To use digital technologies (e.g. ePortfolios, learners’ blogs) to allow learners to record and showcase their work. SELF-REFLECTION - To use digital technologies to enable learners to reflect on and self-assess their learning process. - To put learners’ active uses of digital technologies at the centre of the instructional process. |
Key issues: This best practice regards a dashboard that was integrated in two Coursera MOOCs developed and run by Erasmus University of Rotterdam: a professional development course for higher education teachers on assessment (AHE) and a sustainability course on the role of businesses in achieving the Sustainable Development Goals (SDG). Both courses were in English and self-paced with flexible deadlines.
To begin with, as the authors of the study maintain, learning analytics dashboards (LADs) are feedback interventions designed to increase learner awareness, reflection and ability to self-regulate. However, LADs are passive displays of information and learners are seldom empowered to actively take part in the feedback process. Designing impactful student-facing LADs poses the challenges of selecting meaningful data for learners. Jivet et al. (2021) study addresses this issue and adopts a learner-centred approach by empowering learners to make their own decision about what information they wish to see on a LAD.
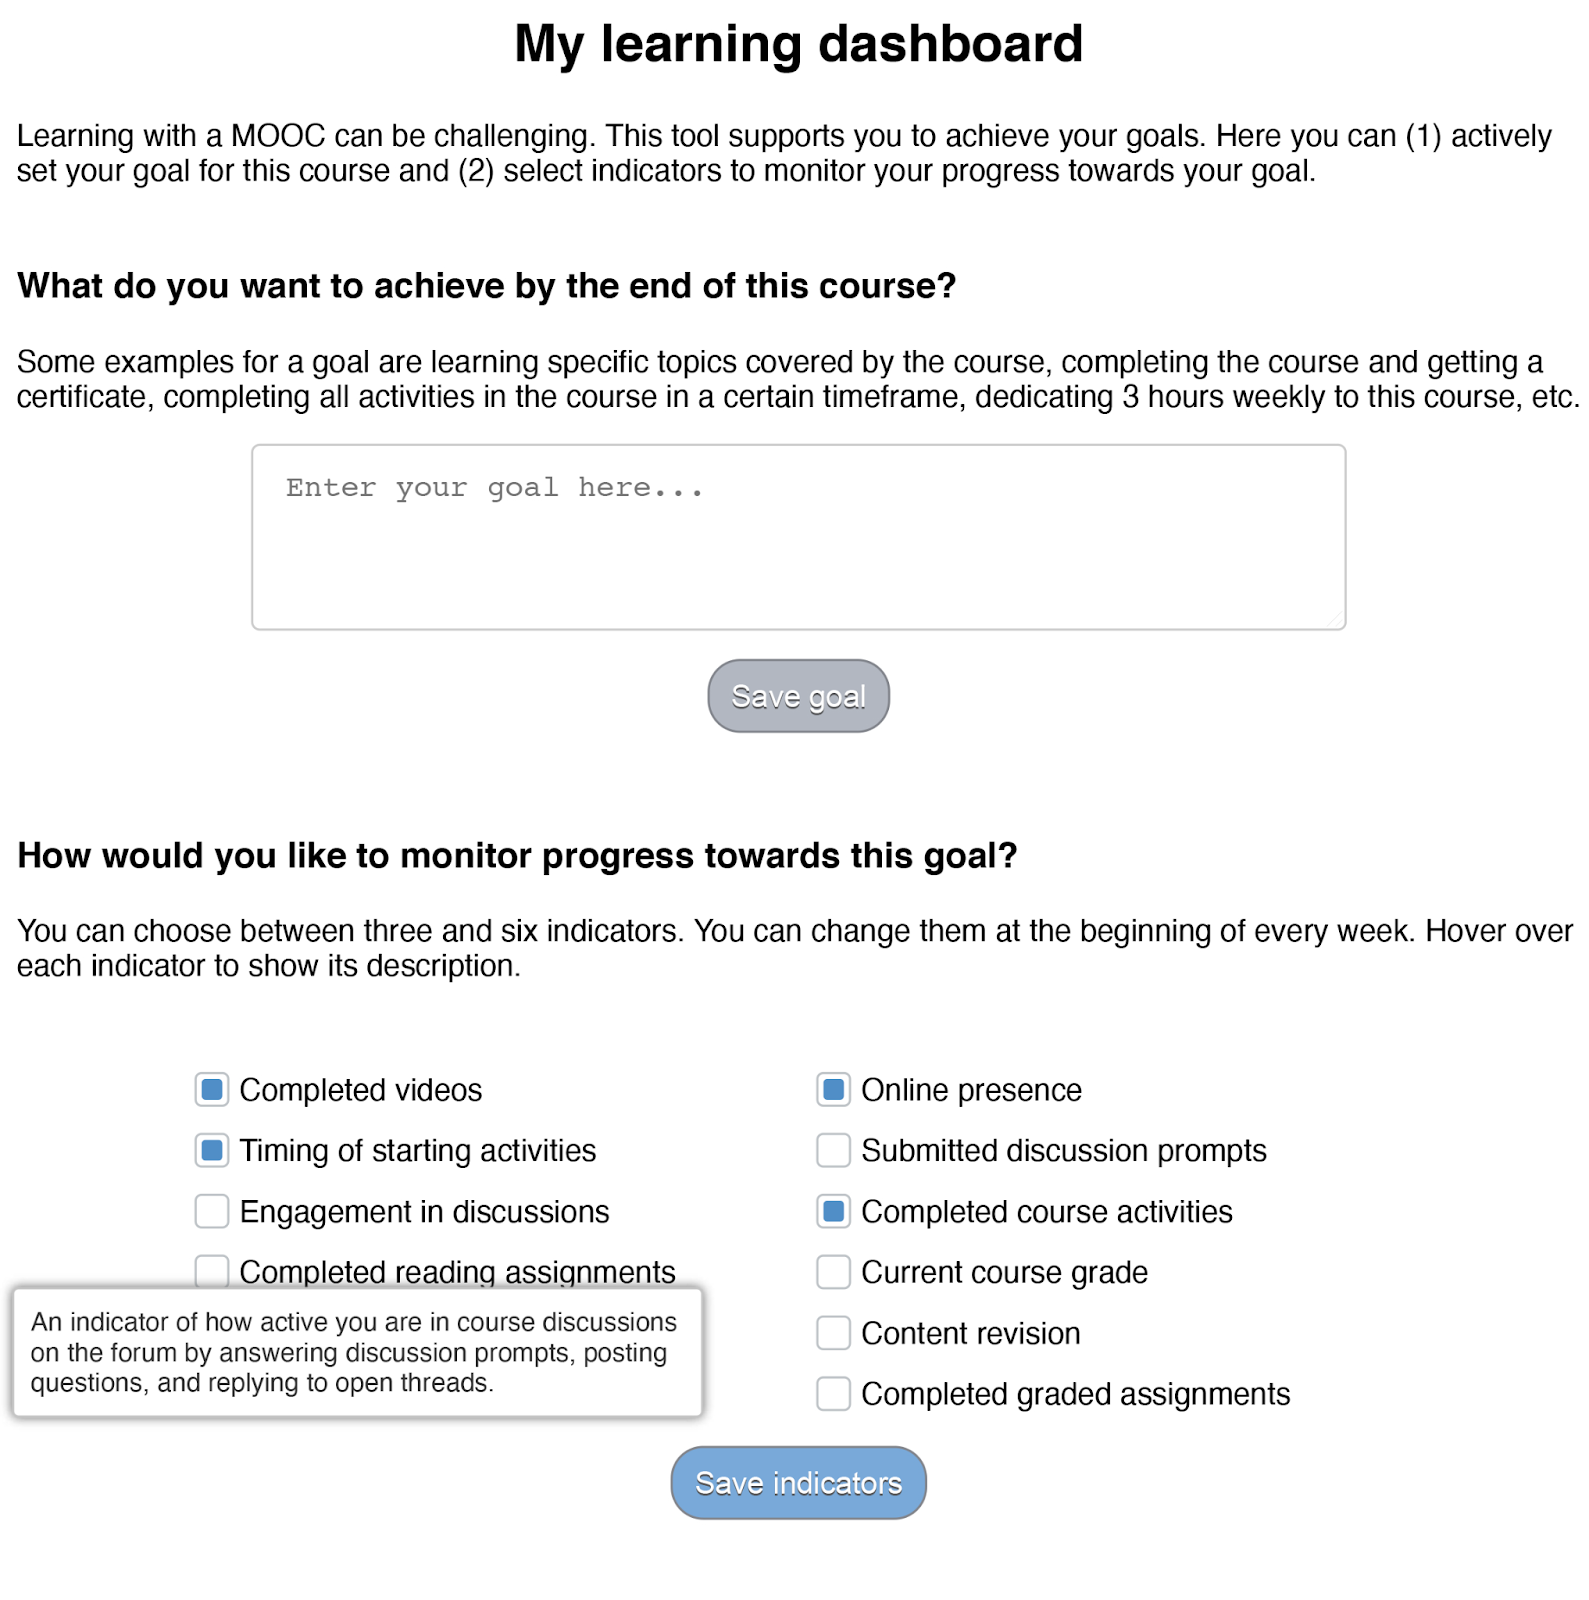
Figure 1. The configurable learning dashboard that greets learners from Jivet et al. (2021, p. 419)
Researchers have built a customisable dashboard on which learners can set goals and choose the information they wish to monitor as part of the process of (self-)regulating their learning towards achieving their goals. The LAD provides regularly updated feedback to learners. Based on the learners’ interactions with the dashboards, the researchers investigated the decisions learners took on the dashboard and the role of learner goals and self-regulated learning skills, two concepts closely connected to how learners process and use feedback.

Figure 2. The widget after having been configured by learners from Jivet et al. (2021, p. 419)
This study shows that making LADs customisable for learners and monitoring their interactions with such devices can provide insights on how students use LADs. Learners chose overwhelmingly content progress indicators, focusing in particular on indicators that report on completed learning activities and not the course grade. The most frequent learning behaviour indicator was B3: Productivity, showing the percentage of learning activities completed on the same day on which they were started. When modelling the learning behaviour indicators selection, two insights are of particular interest. Firstly, results show that learners with higher help-seeking skills are significantly more likely to select and monitor B2: Engagement in discussions. Higher help-seeking skills allow learners to recognise their need for help and know where and when to look for it. This suggests that forums are seen as sources of help only by those learners that are skilled in looking for help. Secondly, time management skills and including a time frame in their goal are significant predictors for the selection of B6: Timing of completing activities. All three concepts are related to prioritising and efficiently allocating time to learning tasks. This indicator might provide learners with a cue for checking whether they are still on track and able to achieve their goals within the specified time frame.

Figure 3. Most commonly selected indicators showing the number and the proportion of learners within each course that selected each indicator. From Jivet et al. (2021, p. 421)
Relevance for teachers: Designing ‘one-size-fits-all’ dashboards puts certain learners at a disadvantage, as skilled learners are more inclined to monitor behaviours associated with higher achievement. Designing impactful LADs need to address learners’ skills levels and also support novice learners in recognising the benefit of monitoring their learning behaviour and use of learning strategies.
Using a customisable dashboard, researchers and teachers collected information that sheds light on learners’ metacognitive processes and self-regulated learning. They could observe the decisions they made with regards to what information they monitor in a learning environment.
Last modified: Thursday, 22 December 2022, 1:34 PM